Analyzing the 2021 Global EV Outlooks: Trending Up
03.07.22 | Member Reports & Posts | By: Tammy Klein
As noted in my original post on this topic, I promised I would keep members updated on an ongoing basis on EV penetration projections — to the extent the data has been publicized and is available. The spreadsheet below includes an update for the year 2021 and you can easily compare it to the data from 2017-2020. For this analysis, I collected 12 major public analyses on EVs from the last year, shown in the graphic below. All of these studies are linked in this spreadsheet so that you can easily navigate to them. I break down:
You can download this graphic or ask me for the PowerPoint slide. You can also access it in the spreadsheet and then modify and use as you like in your own work.

While in 2019 and 2020 EV forecasting slowed down with fewer firms releasing public projections on EVs, last year analyses picked up.
IEA has both a Stated Policies Scenario (SPS, formerly New Policies Scenario) which is based on current policies that have been implemented by governments and a Sustainable Development Scenario (SDS), which assumes governments will set policies to meet net zero targets. In the SPS, the global EV stock across all transport modes (excluding two/three-wheelers) expands from over 11 million in 2020 to almost 145 million vehicles by 2030, an annual average growth rate of nearly 30%. In this scenario, EVs account for about 7% of the road vehicle fleet by 2030.
EV sales reach almost 15 million in 2025 and over 25 million vehicles in 2030, representing respectively 10% and 15% of all road vehicle sales (similar to its 2020 projection). In the SPS, the electric LDV stock rises from about 10 million in 2020 to around 50 million vehicles in 2025 and almost 140 million vehicles in 2030. Globally, the stock share of electric LDVs increases from less than 1% today to 8% in 2030. Sales of electric LDVs rise from 3 million in 2020 to 13 million in 2025 (sales share of 10%) and 25 million in 2030 (17% sales share).
In the SDS, the global EV stock reaches almost 70 million vehicles in 2025 and 230 million vehicles in 2030 (excluding two/three-wheelers). EV stock share in 2030 reaches 12%. In the SDS, almost 220 million electric LDVs are projected to be circulating worldwide by 2030 (of which only 20 million are light-commercial vehicles), corresponding to an almost 15% stock share. Sales of electric LDVs are projected to reach 45 million in 2030 (35% sales share, similar to its 2020 number), an 80% increase relative to the SPS.
For the first time, BNEF presents two scenarios, similar to IEA, shown in the figure below.
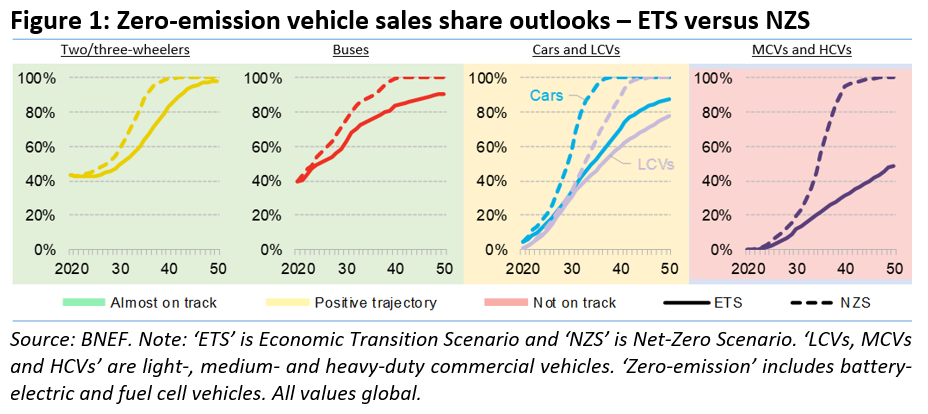
Its Economic Transition Scenario (ETS) is primarily driven by techno-economic trends and market forces, and assumes no new policies or regulations are enacted that impact the market. Its Net Zero Scenario (NZS) looks primarily at economics as the deciding factor for which drivetrain technologies are implemented to hit the 2050 target. To get on track for a net-zero global fleet by 2050, zero-emission vehicles need to represent almost 60% of global new passenger vehicle sales by 2030.
Global sales of zero-emission cars rise from 4% of the market in 2020 to 70% by 2040 in the ETS, ZEVs only achieve a 34% share by that year, though some markets go much higher. The fleet of electric vehicles hits 169 million in 2030 in the ETS but needs to jump to 218 million by the same date in the NZS. Across all segments, sales of new internal combustion vehicles need to be phased out by just after 2035 to stay on track for the NZS.
There remains a divergence of views on the degree of EV penetration on a global basis with no clear trend. Several firms with a deep background and experience in energy tend to take a more conservative view on EVs and are in the minority (e.g. OPEC and me, representing the TES diamond). BNEF, DNV, McKinsey and Wood Mackenzie have the most progressive forecasts featured.
I still take a conservative view with a 10% projection by 2030, and I see most of that focused on EV uptake in China and Europe. Why? Among other reasons, I strongly stand by my view that uptake will be slow in the U.S. through 2030 as infrastructure develops and consumers become more comfortable with the technology. I am not anti-EV. I have just never bought the “EV is like an iPhone consumers will flock to” argument. Consumers are conservative, especially when it comes to their cars, and they are notoriously slow to adopt and adapt to new technology.
A big issue for consumers is the ability to choose a car that they are already used to and like driving, the SUV, at a price point they can afford (below $40,000). I believe the model offerings in the U.S. and EU over the next few years will address this issue and will be helped by incentives.
In the EU, uptake is increasing quickly, driven by policies such as CO2 standards for vehicles and various incentive programs offered by the Member States. But more critical in the EU than perhaps the U.S. is the issue of infrastructure. I believe infrastructure will develop more slowly and will be more complicated in the EU than in the U.S. The reason: more than 60% of households in the U.S. are located in single-family homes that can conceivably add home charging. In the EU, that figure is about 33%.
I believe public charging in the U.S., even with massive federal funding, will develop more slowly than expected due to issues such as permitting and other regulatory approvals needed for utilities to add make ready infrastructure to support charging. With respect to charging, BCG notes in its forecast that, “Our consumer research shows that inadequate charging infrastructure remains a key deterrent for customers who might otherwise pick EVs over ICE vehicles. We estimate that 100 million additional charge points will be required globally in the next decade to keep pace with projected EV growth.”
Insights from other firms on the topic of charging include the following:

Several firms, including BNEF, Deloitte, DNV and S&P Global have projected that EVs will reach cost parity with ICEVs by 2025. BCG projects that battery pack costs will drop to $75 per kWh by 2030.
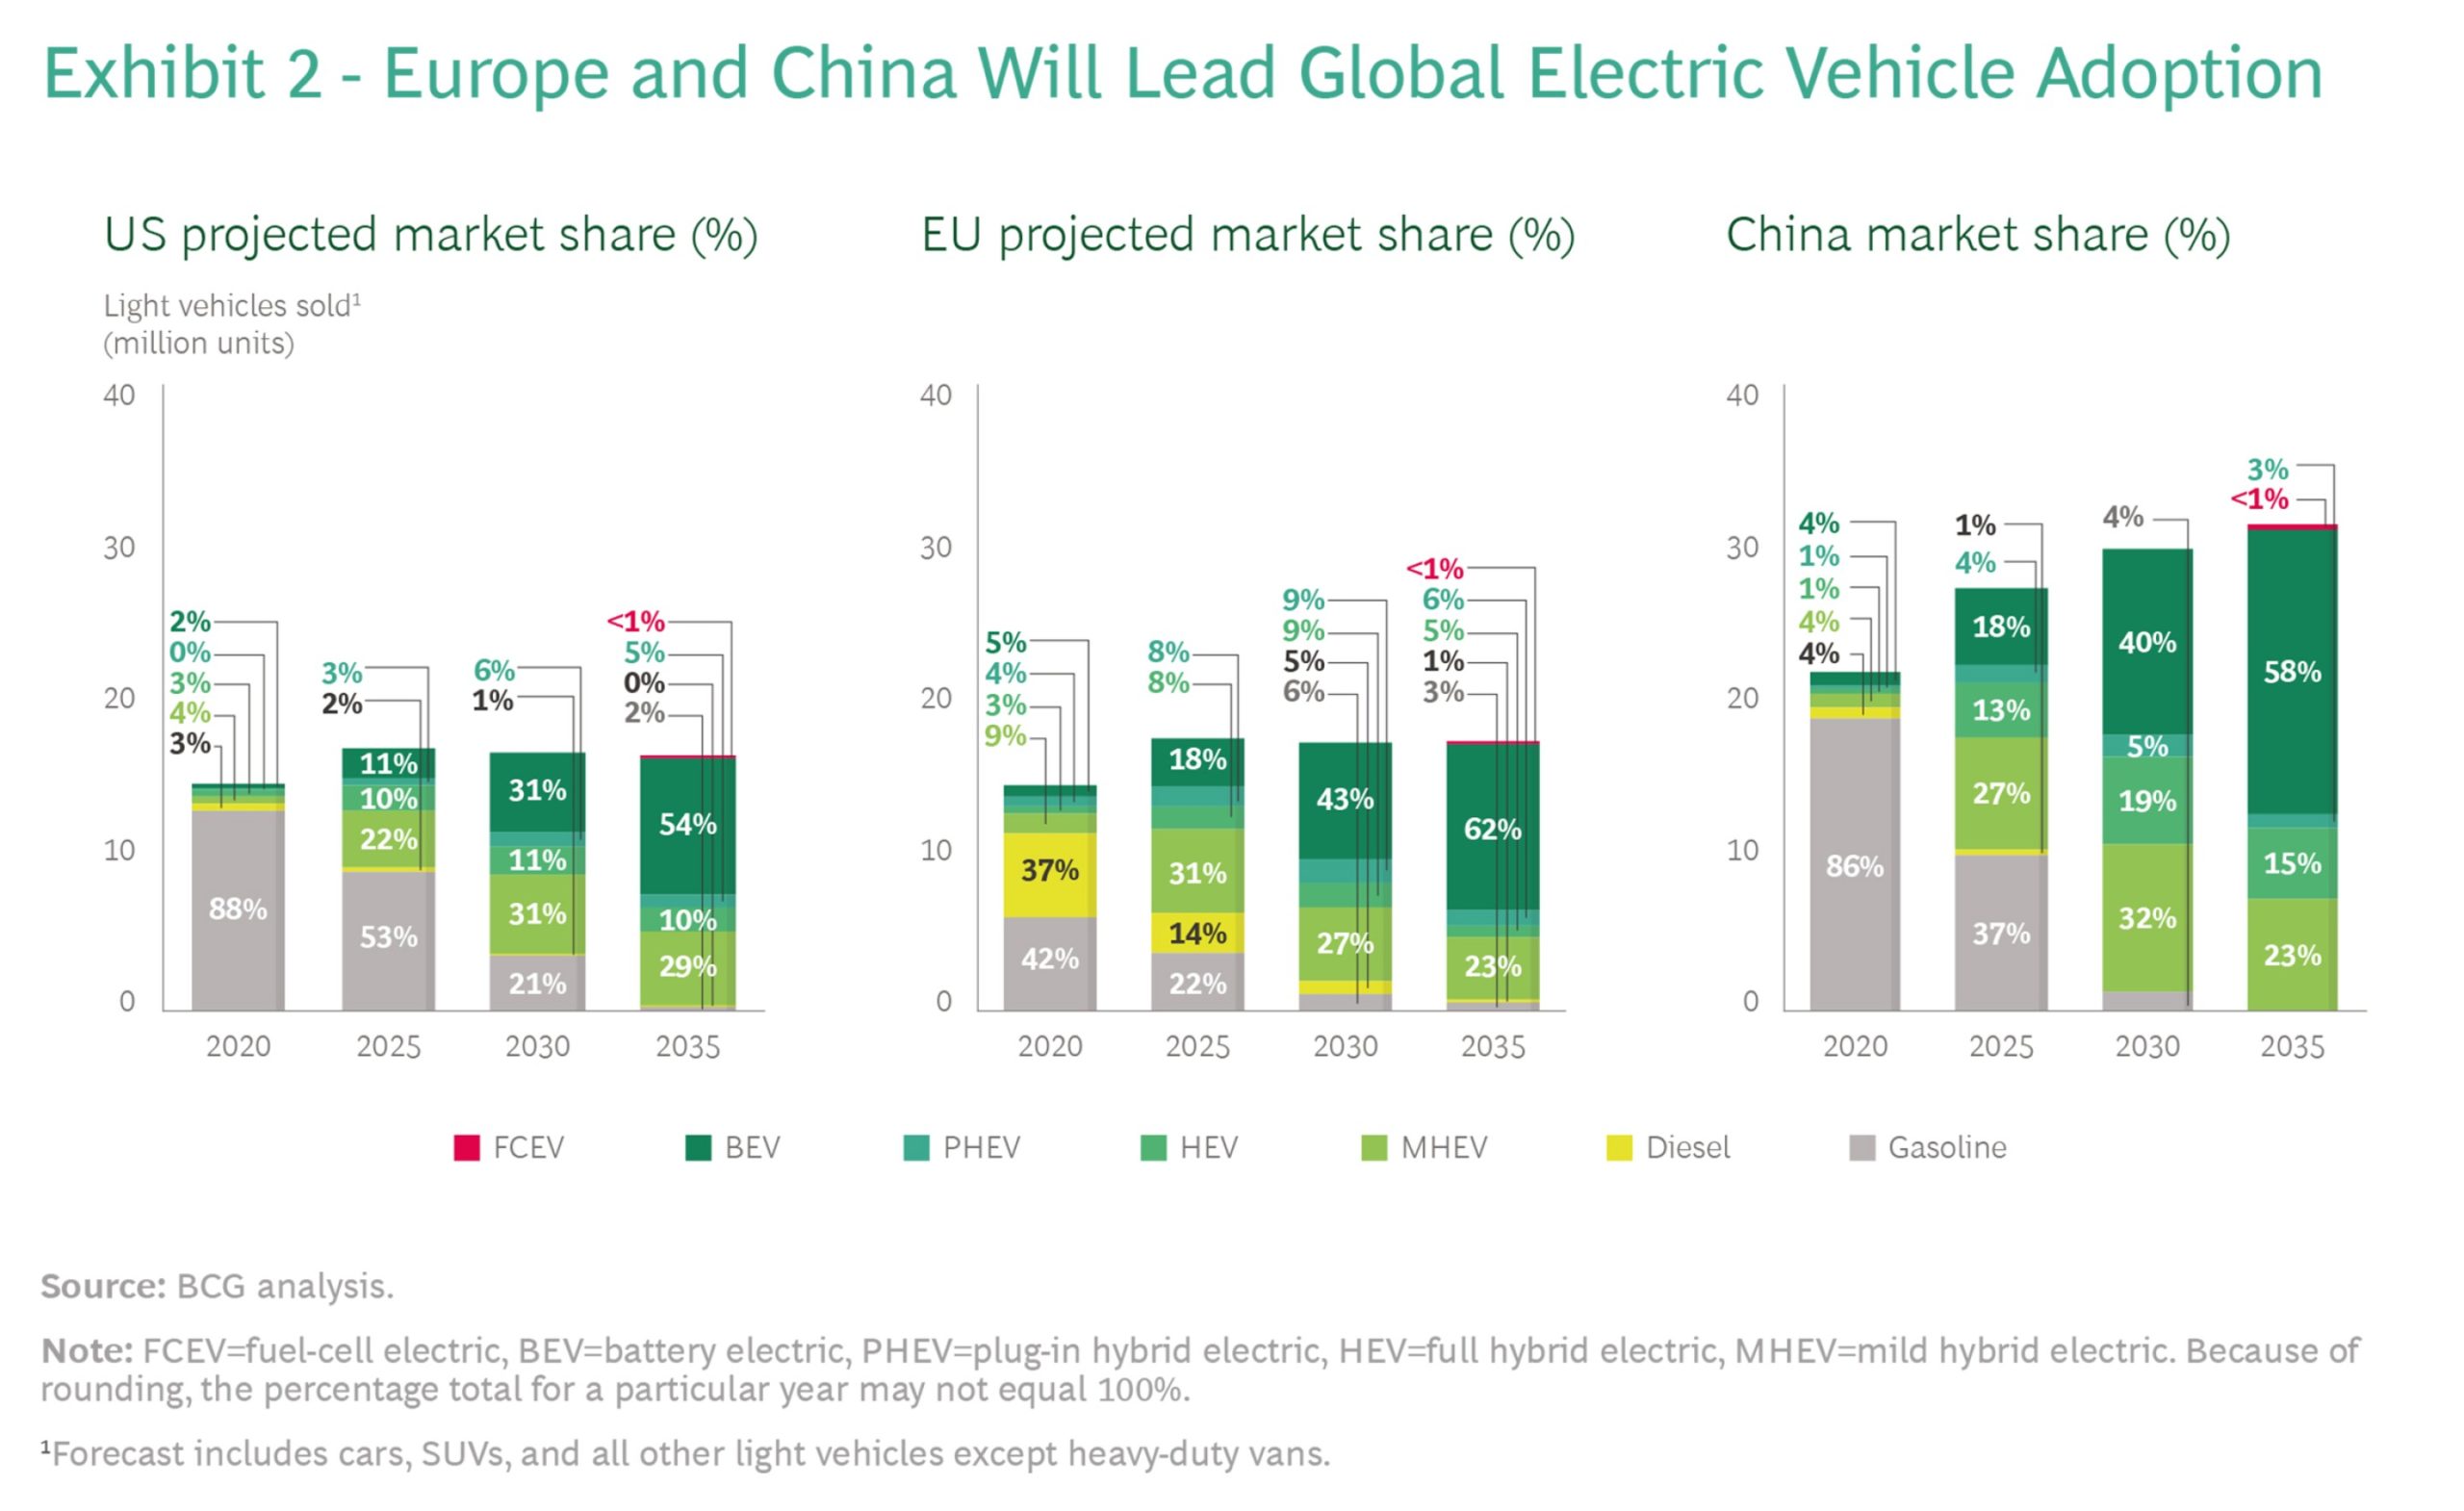
Most forecasts here acknowledge that the two big growth regions for EVs are and will be the EU and China. Insights include:
Several firms had interesting “reality check” comments in their forecasts:
