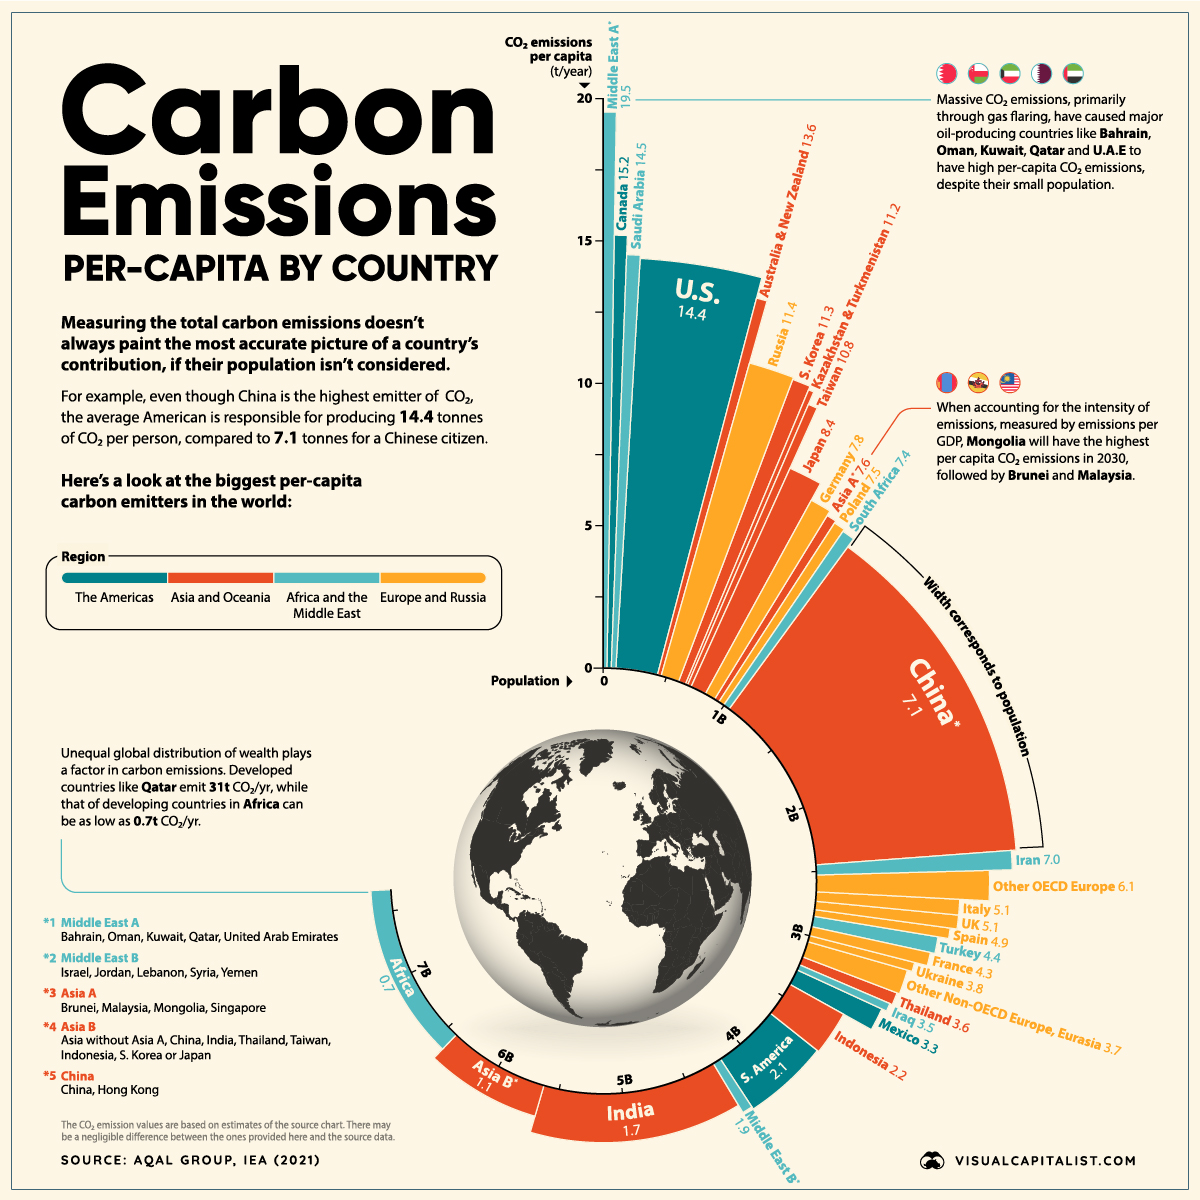
Developing countries like China, India, and Russia are some of the highest producers of CO2 worldwide and will be so for a while. But the situation is far from straightforward—and looking at CO2 emissions per capita can add nuance to the overall story.
Based on data presented by the Aqal Group and the IEA, here we visualize the countries and regions with the highest per capita carbon emissions from around the world.
Let’s dive into the highest per capita carbon emitters and how they are trying to reduce their carbon contributions.
Oil-producing countries in the Middle East are the highest emitters of CO2 on a per capita basis, but developed countries like the U.S., Australia, New Zealand, and Canada also have some of the higher rates of per capita emissions.
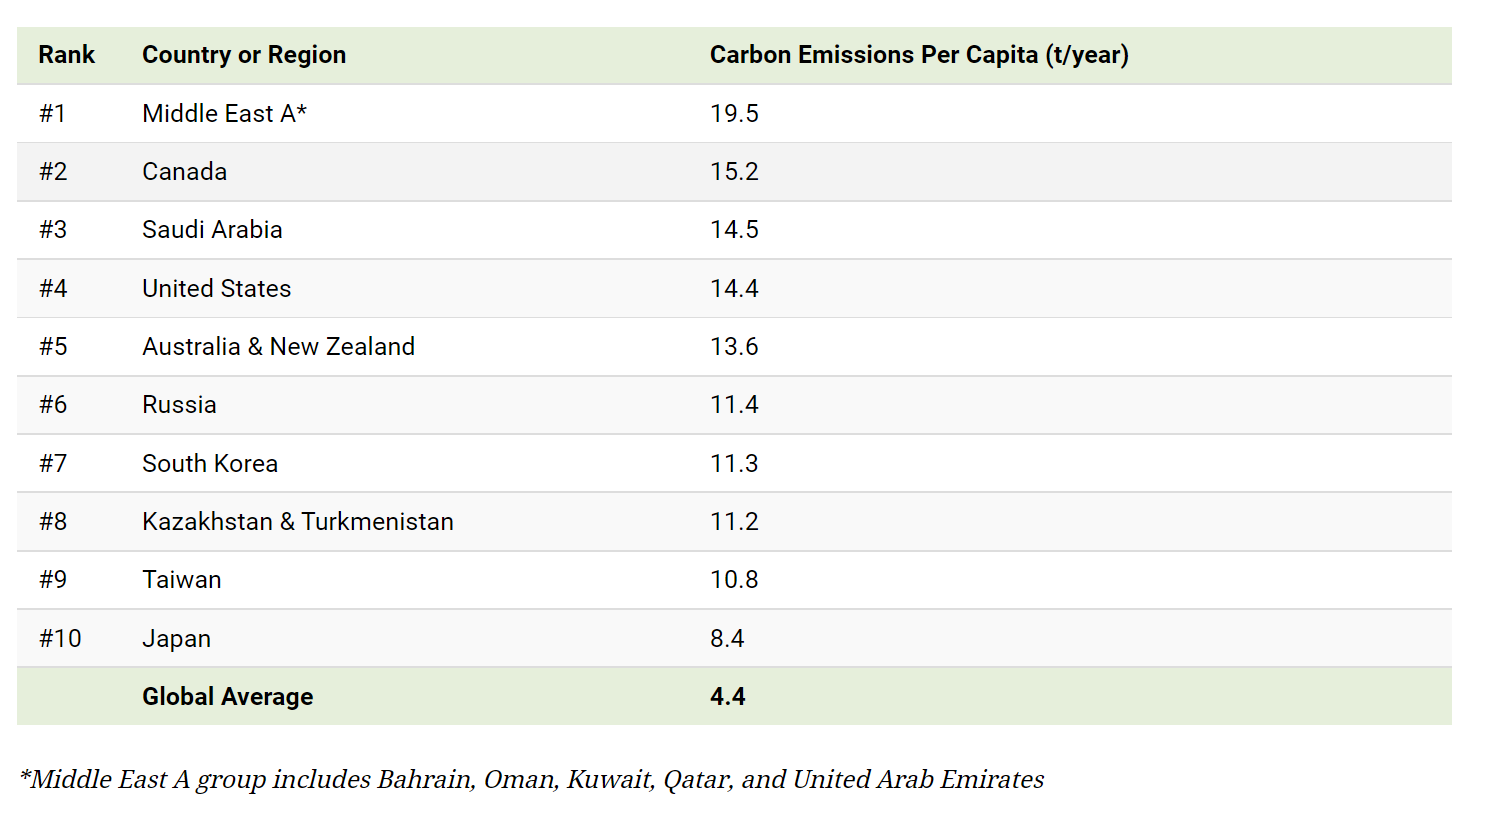
Canada and the United States have per capita carbon footprints of 15.2 and 14.4 tonnes per year, respectively. Meanwhile, Australia and New Zealand combine for an average per capita footprint of over 13.6 tonnes per year.
It’s worth noting that all of these numbers are more than three times higher than the global average, which in 2019 was 4.4 tonnes per person.
Since there is a strong relationship between wealth and per capita CO2 emissions, we’d expect countries with high living standards to have a high carbon footprint.
But the data above shows significant differences in per capita emissions, even between countries with similar living standards. Many countries across Europe, for example, have much lower emissions than the U.S., Canada, or Australia.
Here’s a look at the top 25 countries by standard of living and their share of electricity production from fossil fuels:
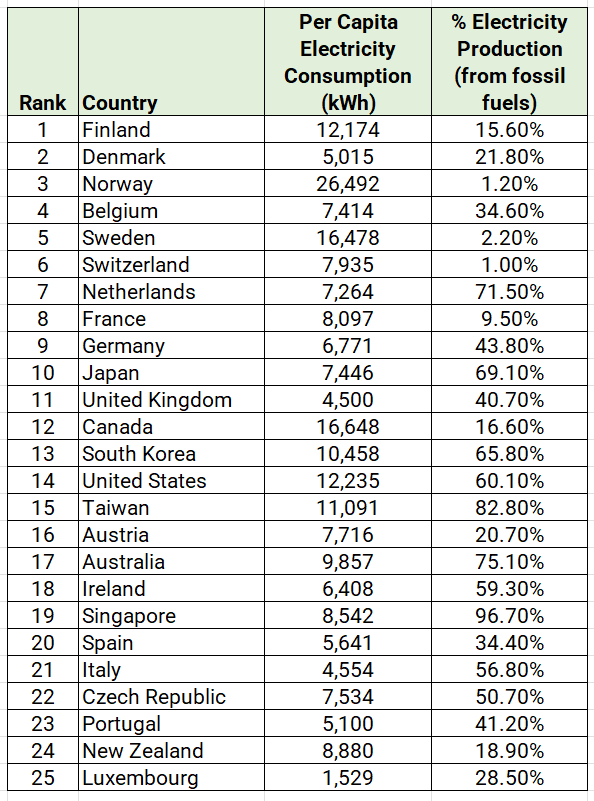
Sources: Electricity consumption, Fossil fuel mix
The choice of energy sources plays a key role here. In the UK, Portugal, and France, a much higher share of electricity is produced from nuclear and renewable sources.
For example, only 9.5% of France’s electricity production comes from fossil fuels, compared to other developed countries like the U.S. at 60.1% and Japan at 69.1%.
This reliance on fossil fuels for energy production extends to the rest of the G20 countries. According to the Climate Transparency Report, CO2 emissions will rise by 4% across the G20 group this year, dropping 6% in 2020 due to the pandemic.
This rise is mainly due to the increase in coal consumption across these countries. Coal consumption is projected to rise by almost 5% in 2021, with this growth driven by China (accounting for 61% of the growth), the U.S. (18%), and India (17%).
Here’s a look at the current coal power capacity of each G20 country:
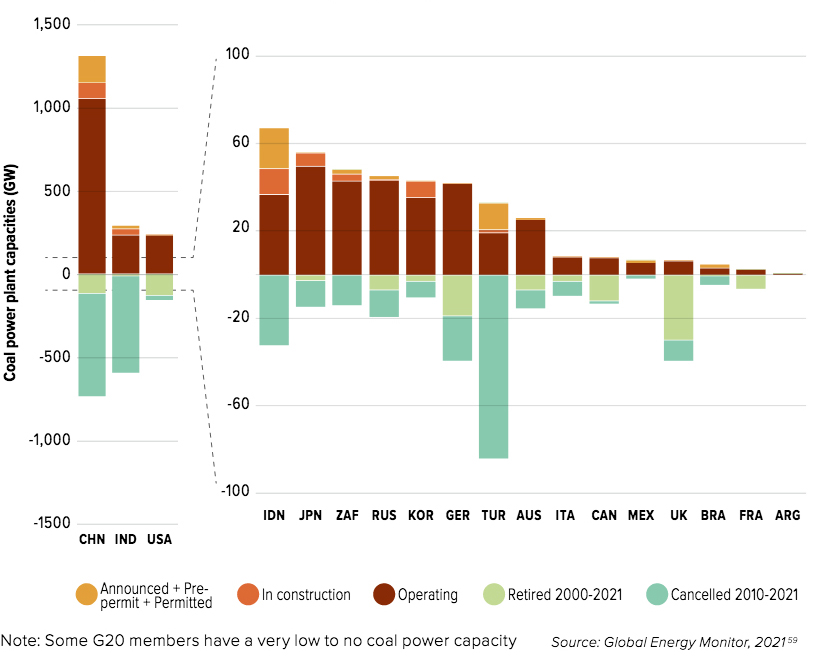
Coal use in China has surged, with the country experiencing increased demand for energy as the global economy has recovered. Coal prices are up nearly 200% from a year ago.
The conclusion of the U.N. Climate Change Conference (COP26) in Glasgow saw several pledges and announcements being made by various countries. Here are some of the highlights:
Many countries have pledged to do their part to tackle climate change. It will be an impressive display of global unity if global CO2 emissions drop significantly over the next decade.
Originally published by Visual Capitalist at this link.
