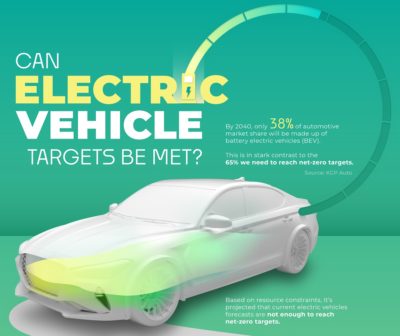
Can Electric Vehicle Targets Be Met?
By 2040, just 38% of the automotive market will be made up of battery electric
Read moreBy 2040, just 38% of the automotive market will be made up of battery electric
Read more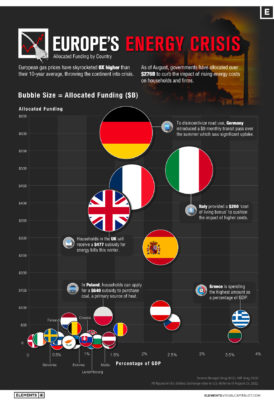
Europe is scrambling to cut its reliance on Russian fossil fuels. As European gas prices soar eight
Read more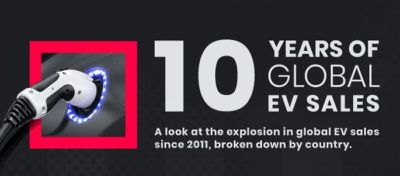
In 2011, around 55,000 electric vehicles (EVs) were sold around the world. 10 years later
Read more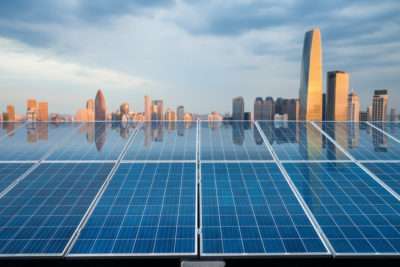
The energy transition will be mineral intensive and create massive demand for all the metals in renewable tech. Electricity from renewable technology grew at the fastest rate in two decades in 2020, according to a report from the International Energy Agency (IEA).
Read moreAt the COP26 conference last year, 40 nations agreed to phase coal out of their
Read more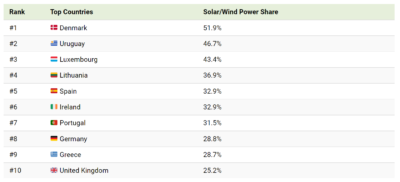
Wind and solar generate over a tenth of the world’s electricity. Taken together, they are
Read more